POWER BI / CASE STUDY / JUL–SEP 2026
Security Intelligence.
Business Insights.
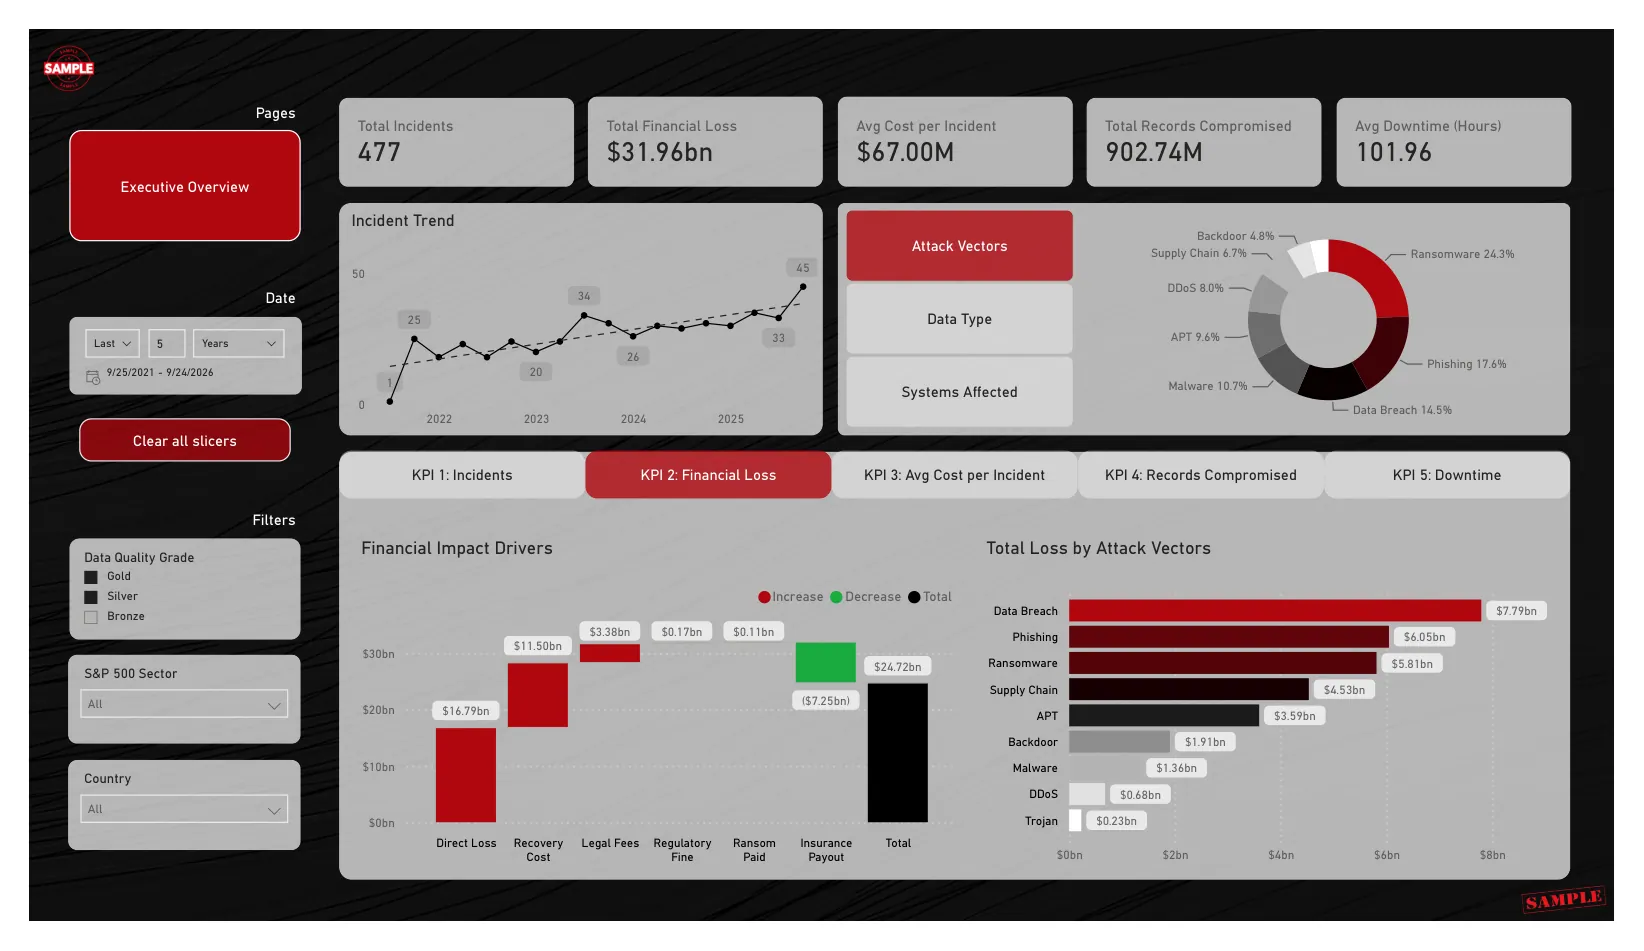
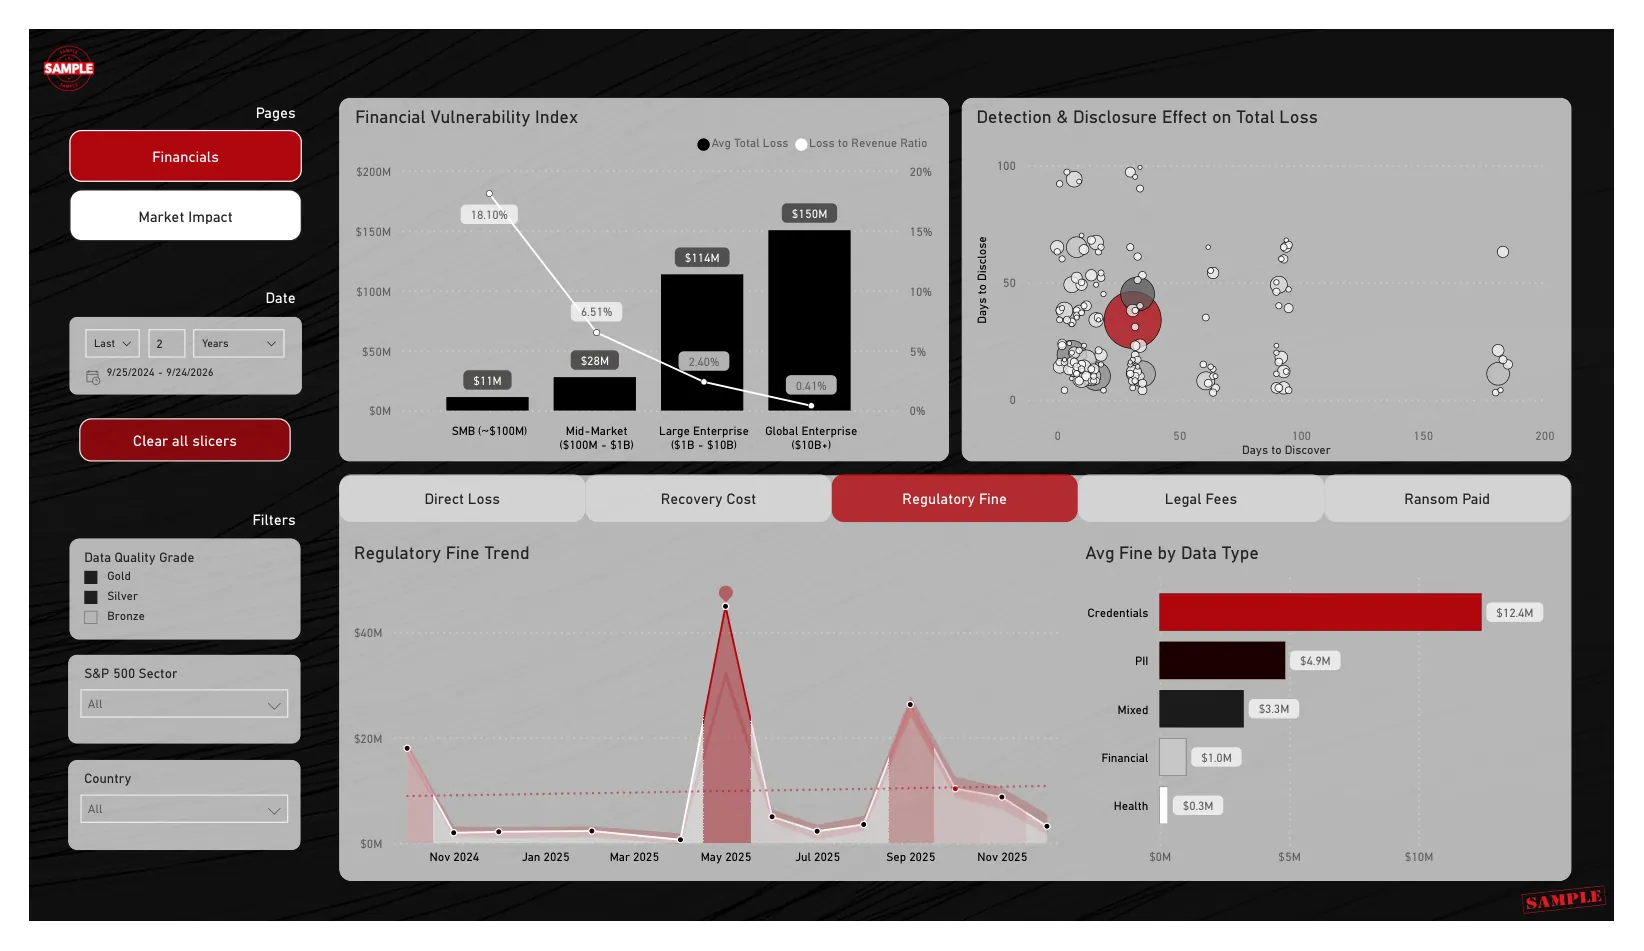
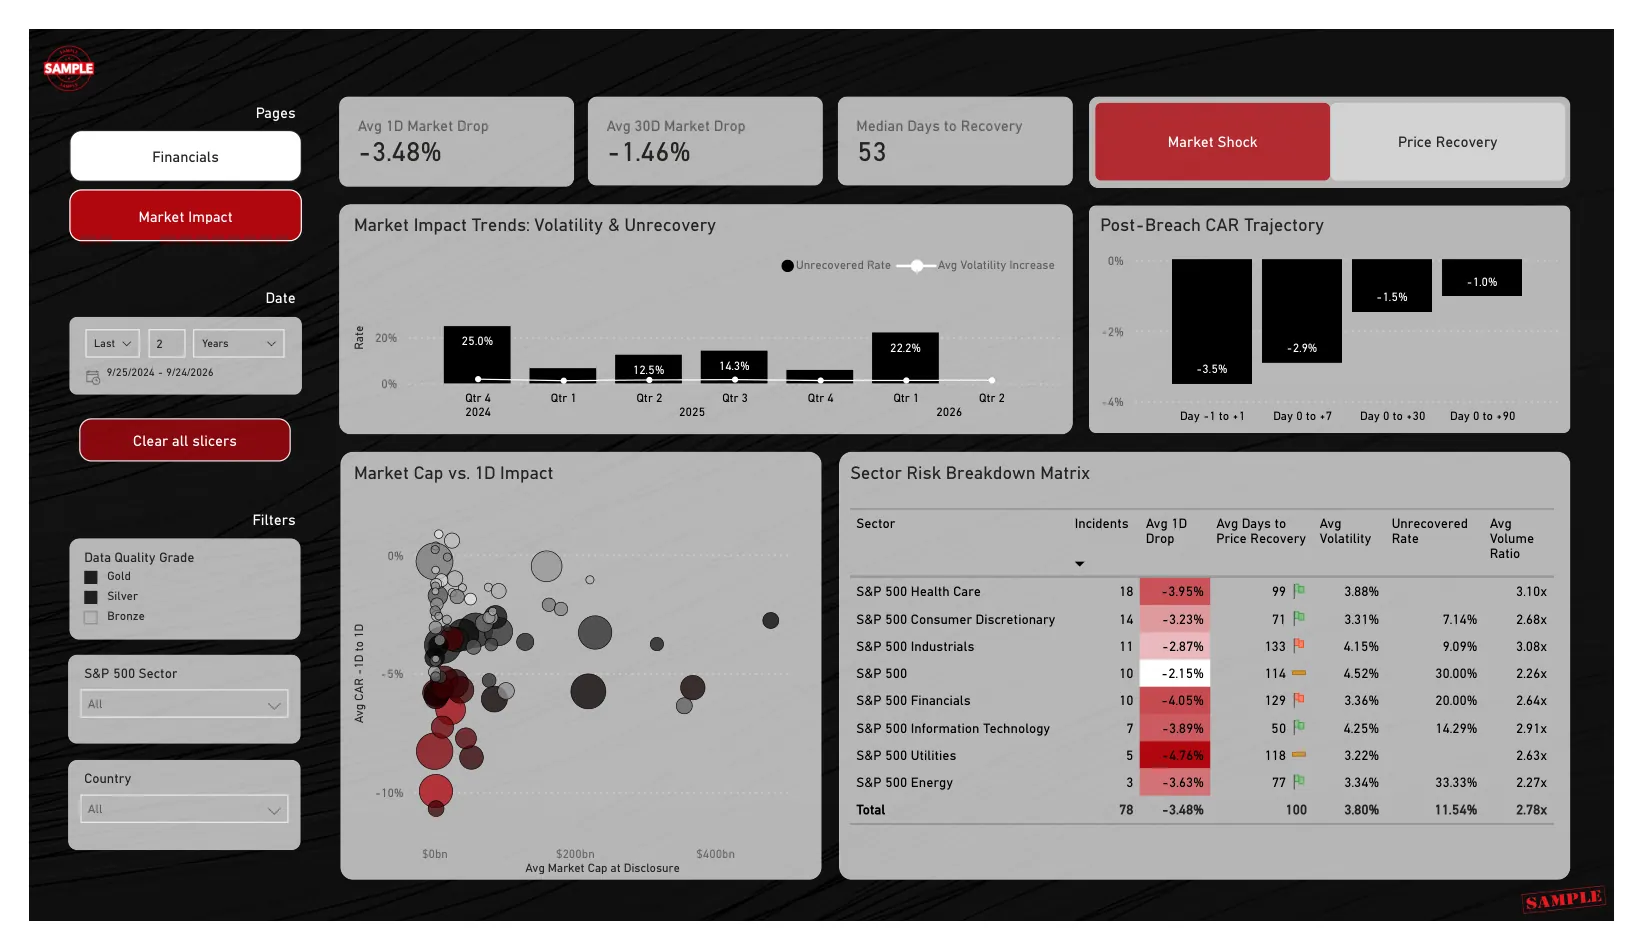
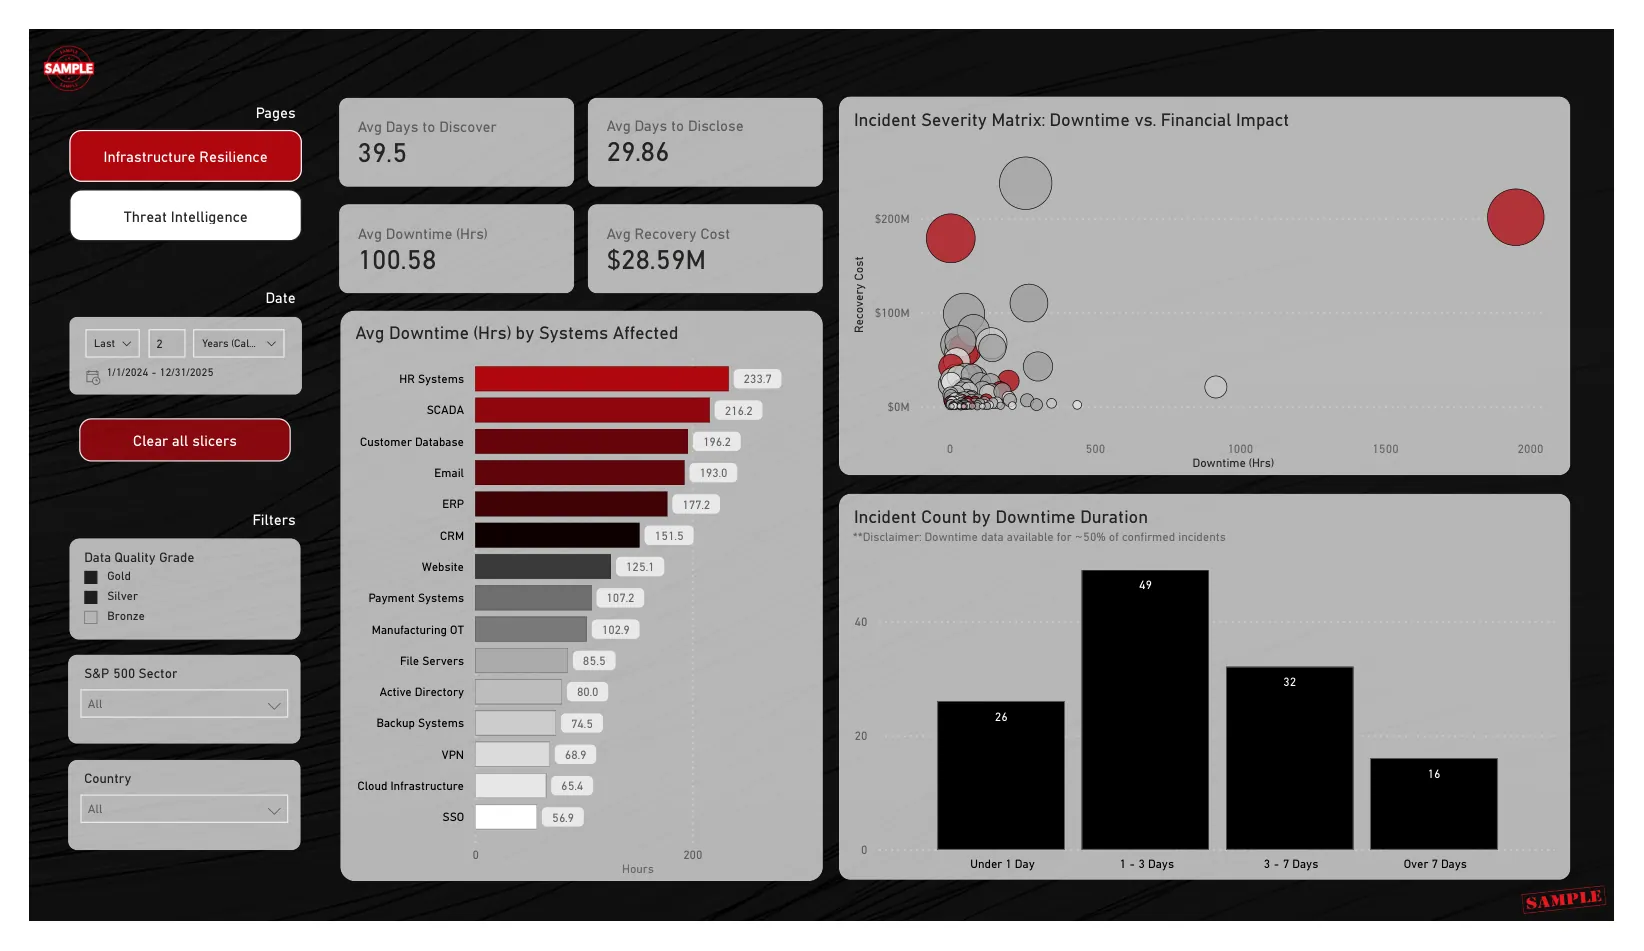
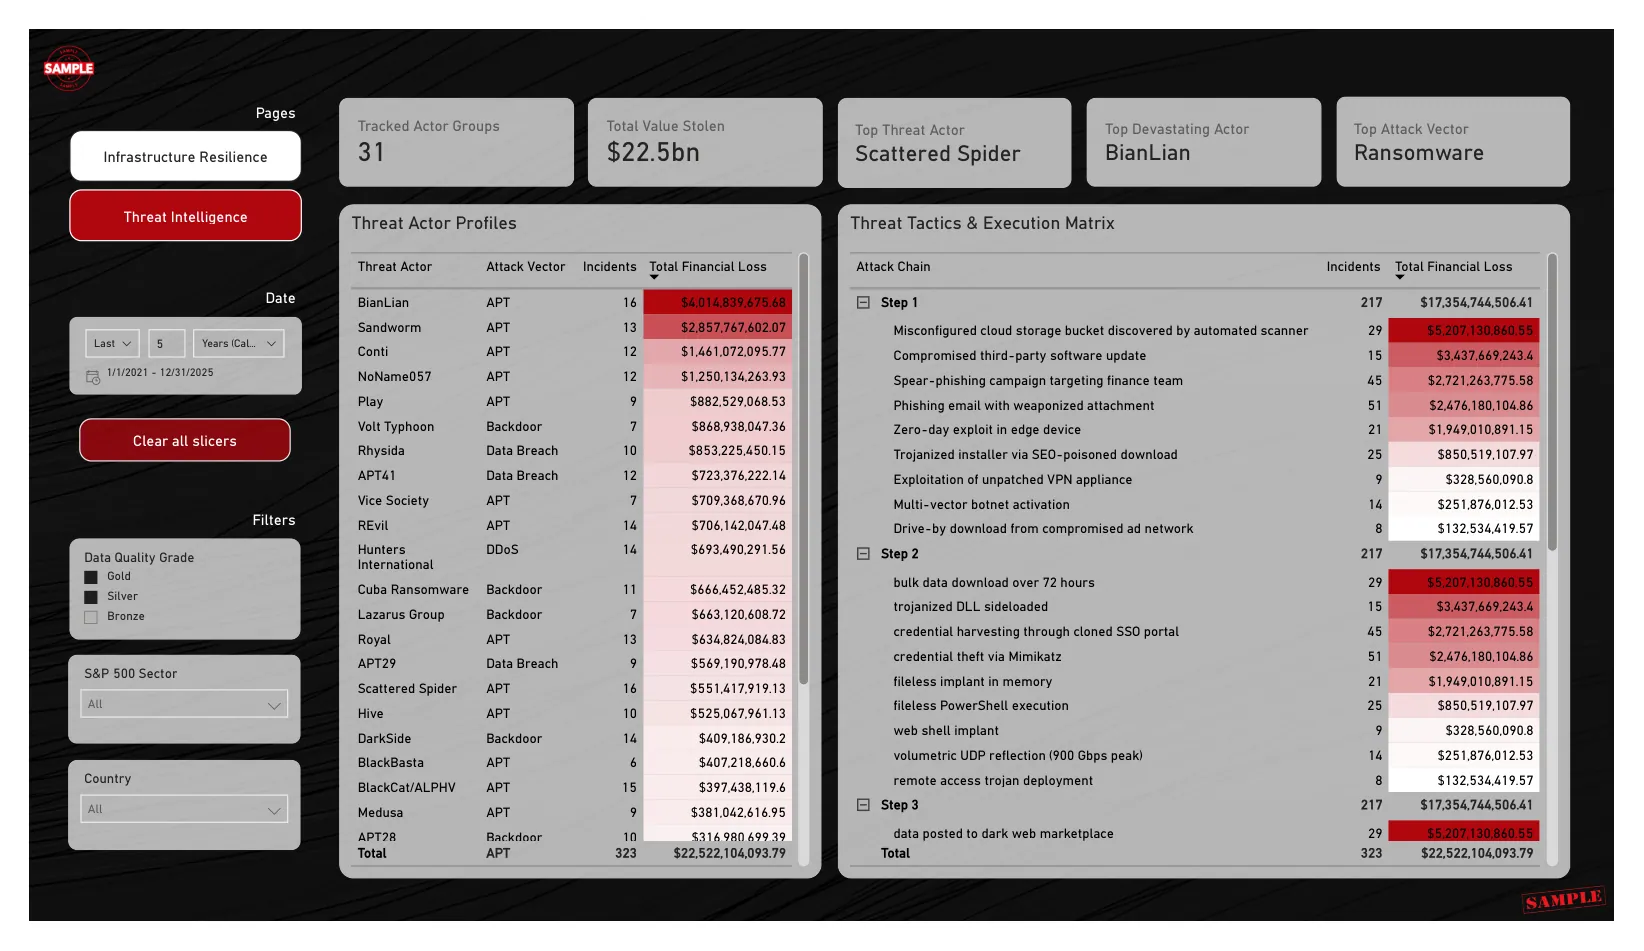
Cybersecurity Threat Intelligence & Financial Risk Analytics Dashboard — an interactive dashboard exploring cybersecurity incidents, financial exposure, market impact, infrastructure resilience, and threat intelligence using a Kaggle cybersecurity breach dataset (2021–2025).
Portfolio dataset demonstration. All metrics shown are derived from the selected Kaggle dataset; they are not verified real-world enterprise losses or forecasts. Screenshots display sample-marked dashboard views.
01 / DASHBOARD GALLERY
Five analytical views.
02 / DEMONSTRATION
Dashboard walkthroughs.
Three short recordings of the original report. Click play to load each video.
Walkthrough 1
Walkthrough 2
Walkthrough 3
03 / PROJECT DETAILS
Built for insight.
Focus
Executive risk reporting; financial exposure and regulatory trends; post-breach market effects; incident detection and disclosure; infrastructure downtime; threat groups and multi-step execution paths.
Methods & tools
Data source
Kaggle — Cybersecurity Breach Impact Dataset (2021–2025).
Personal portfolio project; not employer data.